Sunday, October 1, 2017

NASDAQ Showing Distribution

Using my Modified Volume-Price Trend (MVPT) indicator, I'm seeing distribution in the exchange traded funds that follow the NASDAQ Composite, ONEQ, and the NASDAQ 100, QQQ. 

The MVPT is a refinement of the Volume Price Trend (VPT) indicator, which in turn is a refinement of Granville's On-Balance Volume (OBV) indicator.  Both refinements reduce the noise and volatility of the OBV and keep the indicator close to the price trace in times of "normal" trading while allowing the indicator to diverge from price during phases of accumulation or distribution.  See my article, "Modified Price-Volume Trend Indicator" in the April 2010 issue of Stocks & Commodities magazine [Technical Analysis of Stocks & Commodities, vol. 28 no. 5, p22]. 

Here's the daily bars chart of ONEQ for the last 12 months, price in black candles and the MVPT in purple...

You can see that MVPT is in a dramatic downward divergence from price starting in May of this year.  
Similarly, here's the chart of QQQ...


Here the divergence is even more dramatic.  

What does this mean?  The usual interpretation is that the "smart" money is getting out of the stock even while the price continues to rise.  Usually this foretells a coming drop in the price, but without knowing when that will happen.  See my article for a full discussion of these behaviors.

I've looked at the ETFs following other market indexes.  Some, such as the SPY, show modest distribution, but none as dramatic as these two. 


Wednesday, August 9, 2017

Hockey Stick Amazon - All Done

As this bull market powers on, I'm examining the question, "Are the FANG stocks peaking?"  I'm looking at each of these four on several time frames to see if a TopFinder can be fit to the chart, giving us an indication of whether it's near the end of this up move.  When I looked at Amazon (AMZN) on the very long term time frame - quarterly bars chart - from its IPO in 1997, I saw this most amazing chart...

  This is a hockey stick chart!  It goes from the 2008 low of 34.68 up to this quarter's high (so far) of 1083.31, a 3,124 % increase, a compound growth rate of 26% per year.  When you switch this chart to a semilog display, it shows that a straight line fits the move very well, i.e., this truly has been an exponential move.

What's most interesting to me is that the TopFinder fits perfectly to this move (purple curve) and the algorithm says that the move is done (Who's going to quibble over 0.2%?).  This means that the hockey stick up move is now over.  

The usual caveat...

•  The TopFinder is a concurrent indicator, not a predictive one.  It tells you what is happening now.  It's telling us that this hockey stick move has ended, but it does NOT tell us what comes next - only that it will be different.  So, it's telling you that now is a good time to close out your long position, but it's not necessarily the right place to go short.

Monday, July 3, 2017

The Intermediate Term Market

This is the third blog post on the current status of the market, here the intermediate term timeframe, as shown on this weekly bars chart...


An uptrend (not accelerated) started in early February 2016.  Its first pullback supported at the first Midas support curve, but the second pullback strongly broke down through the second Midas support curve.  This means that uptrend ended.  But quite dramatically, last October, the strong down week that ended that trend came to a screeching halt right at the level of the S2 support curve on the monthly bars chart.  From there, price bounced up sharply into a new accelerated uptrend to which that TopFincder is fitted.  It's about 74% complete now, projected to end at the dashed purple vertical line.  
 
It's interesting to compare this chart with the long term monthly bars one that I just posted.  On the long term chart we see a pullback last fall from which S3 is launched.  That pullback corresponds with the location of the start of the TopFomder on this weekly bars chart.  It appears that the long term and the intermediate term TopFinders will end at about the same point.

The Long Term Market

This is the second of three blog posts on the current status of the market.  Here is the monthly bars chart of SPY...


On this time frame, we see an accelerated uptrend that started mid-2011, with its fitted TopFinder TF1 which ended in mid-2014.  This was followed by a two year long trading range, bracketed by the blue lines.  Late in that trading range, a new accelerated uptrend started in late 2015, spawning a three-fold hierarchy of Midas support curves (S1, S2 and S3), along with a fitted TopFinder which is currently about 78% through its duration of 46 billion shares of cumulative volume.  The purple vertical line marks the projected end of this accelerated uptrend.  And as I said in the last post, ignore the dates that the plotting program has placed on the horizontal axis going into the future.  We will know when the trend ends when we get there, but not before.

Semiannual, Quarter, Month and Week-end Reviews

At the end of last week, we are at the end of the week, the month, the quarter and the half year.  It's time to review what the market, as exemplified by SPY, is doing on all four of these time frames:
•  Very Long Term - Quarterly bars chart
•  Long Term - Monthly bars chart
•  Intermediate Term - Weekly bars chart
•  Short Term - Daily bars chart.

I'll do this in three blog posts here, starting with this one, Very Long Term.

But first, let me reiterate my general understanding:  One cannot predict the market.  Technical analysis, including my Midas tools, does not and cannot predict what prices will do in the future.  Rather, it shows what the market is doing in the present, and it is exquisitely good at detecting and signaling when the market's behavior has changed so that you may keep your trading in line with the market.  And that's how to make money in the market, not by following a prediction, but rather by carefully staying in sync with the market.  So, nowhere in my posts here am I making any prediction of the future movement of the market.


The Very Long Term, the quarterly bars chart

Here is the quarterly bars chart of SPY from its 1993 inception, plotted in candle volume display...
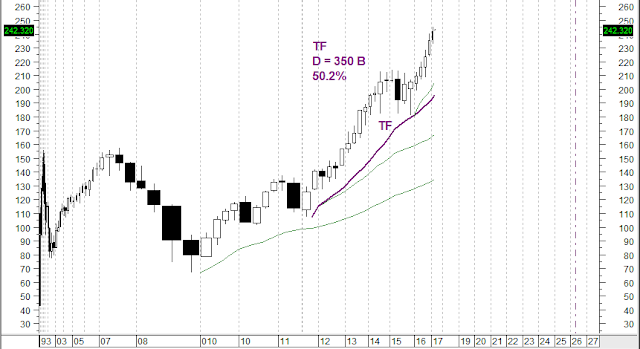


The market has been in an uptrend since that historic bottom in early 2009.  There was a modest pullback in 2011, but from there it launched into an accelerated uptrend.  The definition of accelerated is that the first pullback (here in 2015) occurs far above the Midas support curve launched from the beginning of the accelerated trend - the middle green curve here.  When this happens, we may fit a TopFinder curve (TF) to the trend, the purple curve here.  The value of the free variable, the fitting parameter D, needed to fit the curve to the pullback is the projected total cumulative volume that the trend will have consumed when it ends.  Here, D is 350 billion shares.  Right now, the accelerated trend's cumulative volume is 50.2% of D, so at present we are half way through the duration of this accelerated trend as measured by cumulative volume.  Since the chart's horizontal axis is linear in cumulative volume, not time, I can and have placed that dashed purple vertical line at the horizontal location corresponding to 350 billion shares of cum vol, which is the projected horizontal location of the end of this trend. 

Notice that this is not a prediction of when and at what price the trend will end; we don't know when and at what price, but we will know when we get there because D will have been fully consumed.  The date we get there depends entirely on what the trading volume per quarter will be going forward, which we don't know.  This chart is produced by MetaStock, and that program makes some very dubious assumptions about what the future trading volume per quarter will be and places dates in the future accordingly.  Those date should be completely ignored.

Conclusion:  On this time frame the market is half way in cum vol through an accelerated uptrend that began in mid 2011. 

Saturday, March 11, 2017

The End of the Trump Rally

A number of analysts, citing various combinations of indicators, are saying that the so called Trump Rally that started after the election has ended.  Here I'll show that all one needs is the Midas TopFinder algorithm to know that that rally has just now ended.

Look at my Jan. 1, 2017 post here called The Intermediate Term Market, an analysis of the weekly bars chart of SPY.  It shows the beginning of the rally in early November.  I said, "...price bounced up sharply into a new uptrend.  The most recent few weeks have shown some weakness, but we're still far above the support curve for this trend, so we're still in an uptrend on this timeframe."

After Jan. 1, that brief weakness reversed and the market resumed the strong uptrend.  The Jan. weakness was the first pullback within that strong uptrend.  Since that pullback was far above the Midas S curve launched from the beginning of the trend, that meets the definition of an accelerated uptrend, so one may fit a Midas TopFinder curve to that pullback which I have done in this new chart updated to yesterday.


The value of the fitting parameter D that is necessary to make the curve fit the Jan. pullback is 7.6 billion shares of cumulative volume.  In the upper pane we see that the actual cumulative volume since the election is 7.477 billion shares, which is 98% of D.  That's close enough to declare that the TopFincer curve has ended, and thus the Trump Rally is over.

Now, as I've emphasized in these blog posts many times, the TopFinder is a concurrent indicator, not a predictive one.  It has identified that now is the end of that rally, but it does not predict what comes next.  Typically, after such an end, we get some kind of a consolidation, after which the market does something new, which could be either a down move or an up move.  All we can be fairly certain of is that the accelerated uptrend that has come to be known as the Trump Rally has ended.

Sunday, January 1, 2017

Short Term Timeframe

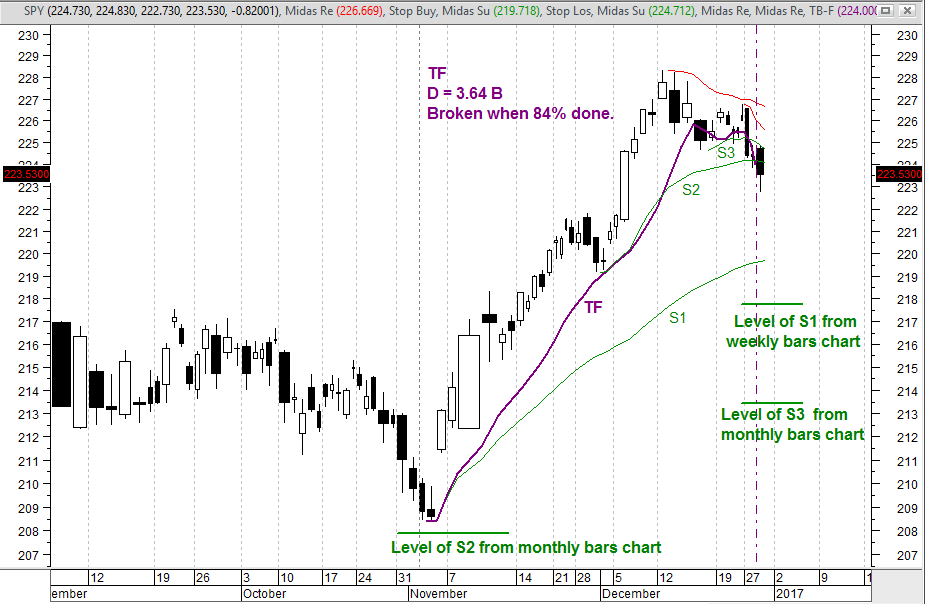
This is the fourth and last blog post in this series, here showing the short term status of the market as displayed on the daily bars chart...


Here an accelerated uptrend started in early November last year, with the TopFinder TF fitted to it, and spawning a three-fold hierarchy of Midas support curves - S1, S2 and S3.  The TF ended last Thursday, but about two weeks earlier, price definitively broke and closed below TF.  So, the TopFinder came to a premature end.  Is this a failure of the methodology?  No, it means some exogenous unexpected event abruptly changed the behavior of the market, breaking the TopFinder.  Sometimes, this can and does happen.  Up until that break, the TF was correctly telling us that the market was in an accelerated uptrend.  And at that break, the TF gave us a prescient early notice that the uptrend has ended.  Since then, price has broken down through S3 and S2.

We now see that we are in a new downtrend that started at the mid October peak, spawning a hierarchy of Midas resistance curves (red).  We don't know, and cannot predict, how low this downtrend will go, but we have identified a ladder of support levels under the current price - the S1 of this chart, the level of the S1 from the weekly bars chart, and the level of S3 from the monthly bars chart.  Going forward, if we see price turning up at one of these levels, that could well be the end of this downtrend. 

This ends my four blog post review of the market.  HAPPY NEW YEAR EVERYONE!