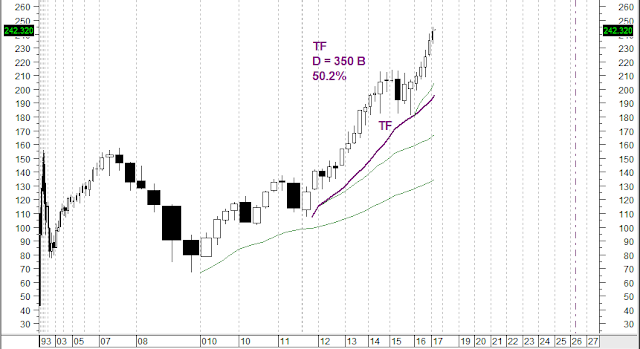
• Very Long Term - Quarterly bars chart
• Long Term - Monthly bars chart
• Intermediate Term - Weekly bars chart
• Short Term - Daily bars chart.
I'll do this in three blog posts here, starting with this one, Very Long Term.
But first, let me reiterate my general understanding: One cannot predict the market. Technical analysis, including my Midas tools, does not and cannot predict what prices will do in the future. Rather, it shows what the market is doing in the present, and it is exquisitely good at detecting and signaling when the market's behavior has changed so that you may keep your trading in line with the market. And that's how to make money in the market, not by following a prediction, but rather by carefully staying in sync with the market. So, nowhere in my posts here am I making any prediction of the future movement of the market.
The Very Long Term, the quarterly bars chart
Here is the quarterly bars chart of SPY from its 1993 inception, plotted in candle volume display...
Notice that this is not a prediction of when and at what price the trend will end; we don't know when and at what price, but we will know when we get there because D will have been fully consumed. The date we get there depends entirely on what the trading volume per quarter will be going forward, which we don't know. This chart is produced by MetaStock, and that program makes some very dubious assumptions about what the future trading volume per quarter will be and places dates in the future accordingly. Those date should be completely ignored.
Conclusion: On this time frame the market is half way in cum vol through an accelerated uptrend that began in mid 2011.

No comments:
Post a Comment