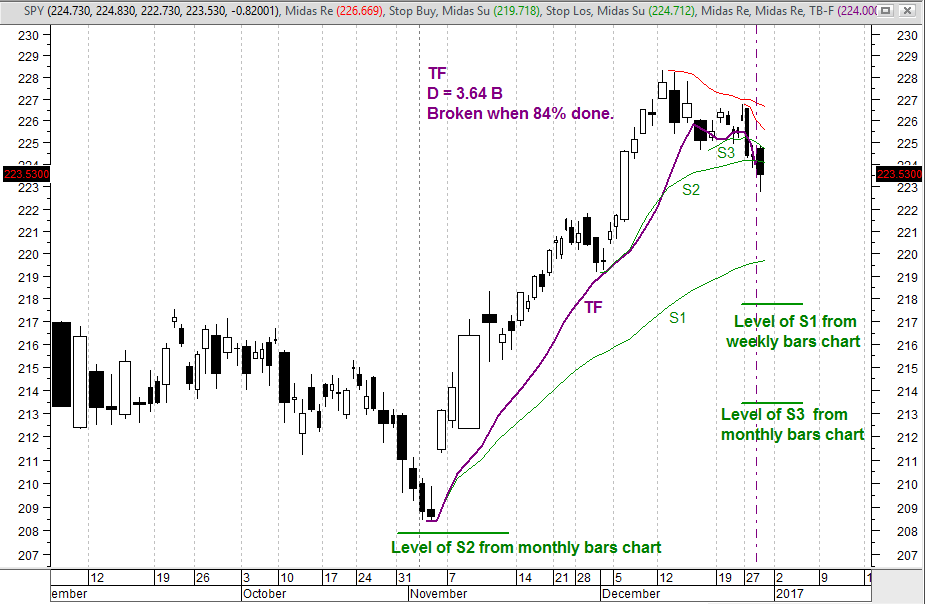
Here an accelerated uptrend started in early November last year, with the TopFinder TF fitted to it, and spawning a three-fold hierarchy of Midas support curves - S1, S2 and S3. The TF ended last Thursday, but about two weeks earlier, price definitively broke and closed below TF. So, the TopFinder came to a premature end. Is this a failure of the methodology? No, it means some exogenous unexpected event abruptly changed the behavior of the market, breaking the TopFinder. Sometimes, this can and does happen. Up until that break, the TF was correctly telling us that the market was in an accelerated uptrend. And at that break, the TF gave us a prescient early notice that the uptrend has ended. Since then, price has broken down through S3 and S2.
We now see that we are in a new downtrend that started at the mid October peak, spawning a hierarchy of Midas resistance curves (red). We don't know, and cannot predict, how low this downtrend will go, but we have identified a ladder of support levels under the current price - the S1 of this chart, the level of the S1 from the weekly bars chart, and the level of S3 from the monthly bars chart. Going forward, if we see price turning up at one of these levels, that could well be the end of this downtrend.
This ends my four blog post review of the market. HAPPY NEW YEAR EVERYONE!
Thank you for posting! I too am a student of MIDAS =)
ReplyDelete