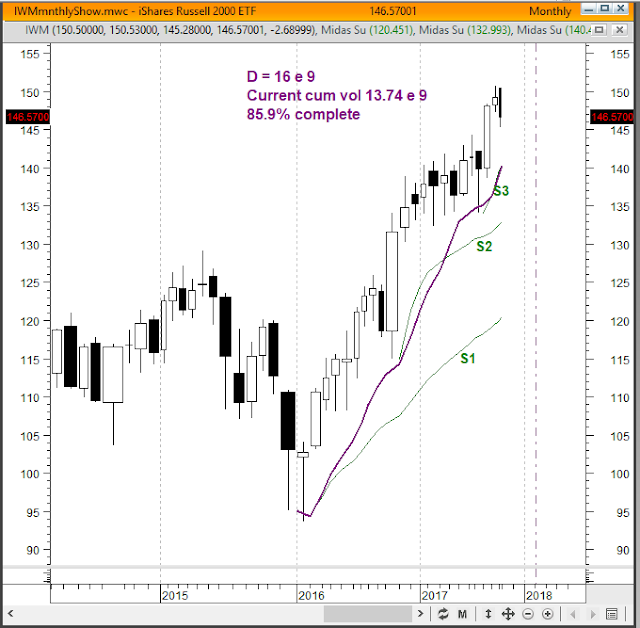
Let's apply the same kind of analysis to the small caps as I've done in my last few posts here. Looking at the charts of IWM, the etf tracking the Russell 2000, I see different behaviors compared to the NASDAQ and the DOW. The weekly bars chart of IWM doesn't show an accelerated up trend, but the monthly bars chart does, and here it is...
We see an accelerated up trend that started in early 2016. I did the compromise fit of the TB-F curve at those two major pullbacks which shows that this up trend is about 86% complete in terms of cumulative volume. If average monthly trading volume continues as it has been for the last several months, this trend will end in about four or five months. My usual caveats apply.

No comments:
Post a Comment