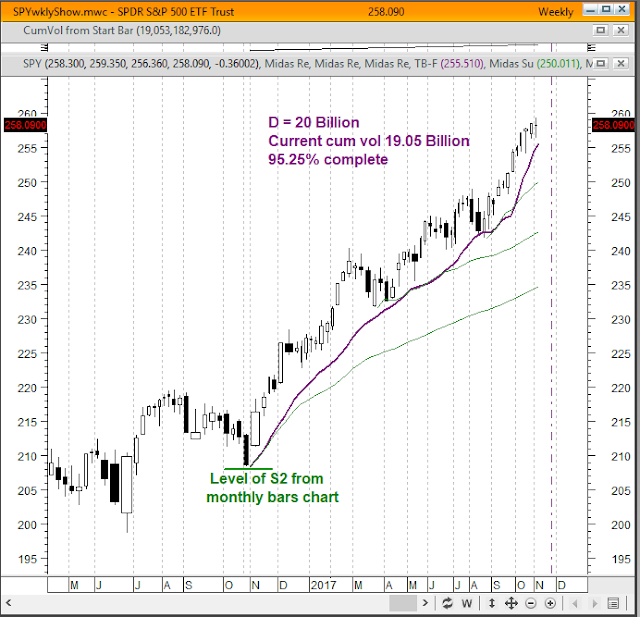
And now, for my final post of today, let's apply the same analysis to the S&P 500 as I did in my last few posts here. Here's the weekly bars chart of SPY, the etf tracking the S&P 500...
Here I did the compromise fit of the TB-F to those two major pullbacks, which reveals that this accelerated up trend that began a year ago is 95% complete in terms of cumulative volume. If average weekly trading volume continues as it has been for the last several weeks, this will get to 100% complete in about 2 or 3 weeks. But, as I've said before, because of typical end of trend volatility, if a TB-F is at least 95% complete, the actual price up trend may already be done. So, we can conclude that the S&P 500's up trend is either done now or will be in the next few weeks.

No comments:
Post a Comment